D3 Linked Bar Charts
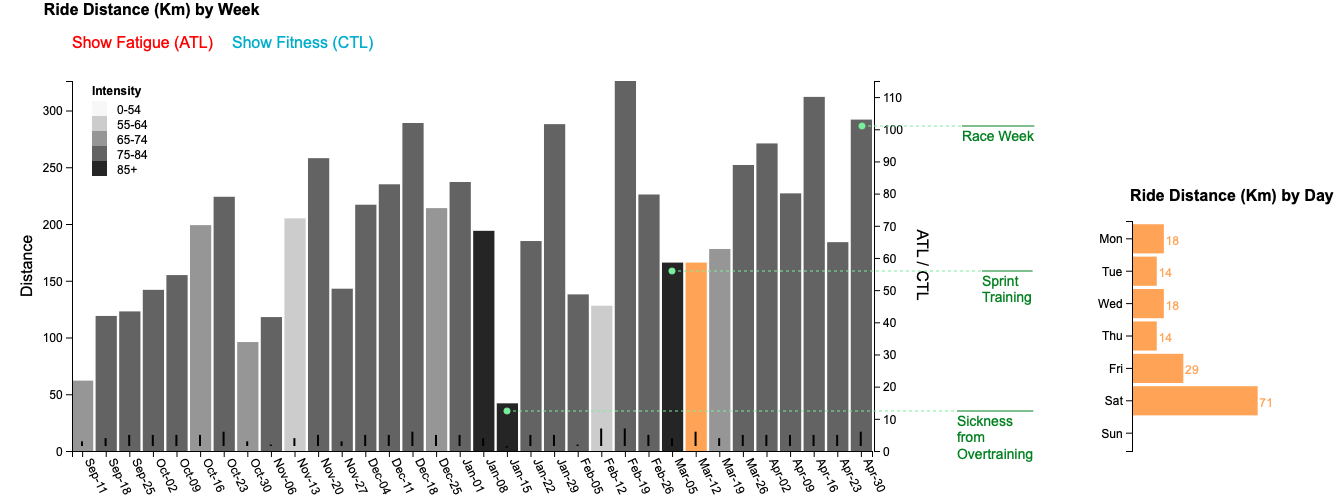
In this I project I use D3.js to create a linked chart visualization to examine bike training effectiveness leading up to a race. I specifically wanted to focus on choosing contrasting colors to highlight the current selection as well as shades of grey to represent training intensity.
The charts include some neat D3 features, such as hover over, overlaying line charts and linked charts and annotations.
Check out the interactive chart here: Visualization
D3 code is available on github
